I spend a lot of time on long-distance trains. In the United States, those trains pass through areas with little or no cell signal, leading to long stretches of limited internet access. I’ve written about that challenge over years; the Capitol Limited/Floridian and Empire Builder stand out for their long stretches of signal loss.
This week I took the Floridian from Pittsburgh to Washington, D.C., by way of Harpers Ferry. It’s a beautiful route, following the Youghiogheny and Potomac rivers, and I decided to try measuring signal strength using the onboard WiFi.
Uptime
First, I set up uptime-kuma on my laptop. I’d used it before to monitor my ISP’s nameservers. I configured two monitors, each running once a minute. One tried to resolve amtrak.com using Cloudflare’s DNS, while the other tried to load this blog within a normal timeout (a harder task). The app is built on Javascript and writes to SQLite, which is ideal for my low-connectivity testing.
This part worked well. I generated 654 rows over approximately six hours. The relevant table in the database is heartbeat, and DB Browser for SQLite has an option for dumping a table to a CSV. I then used a Jupyter notebook to pare the data down to the ping times from the DNS resolver and the timestamp:
1 | import pandas as pd |
This gives me a DataFrame like this:
1 | ping Time |
Geolocation
I hadn’t thought ahead about how I would geolocate the data, so I fell back on exporting my timeline information from my Android. I don’t think you can use Google Takeout for this now because it’s stored directly on the phone. See this article from Android Authority about how to create an export.
The export contains your full history in a large JSON file, while for this project I want six hours. I used the Location History JSON Converter python script to transform the JSON file into a CSV containing only the day of the trip.[1] I used the same Jupyter notebook to create a DataFrame with time, latitude, and longitude.
1 | import pandas as pd |
Combining the data
At this point I have two data sets: the ping data, indexed by time, and the location data, also indexed by time. However, the timestamps are dissimilar. I tried a few techniques before landing on pandas’ merge_asof function:
1 | combined_df = pd.merge_asof(df_ping, df, on="Time", direction="nearest", tolerance=pd.Timedelta("15m")) |
The important part is direction="nearest"; this compensates for non-matching timestamps. To avoid matching two wildly dissimilar points, I set the outer boundary to fifteen minutes. The result is a DataFrame that combines the ping and geolocation data:
1 | ping Time Latitude Longitude |
Next steps
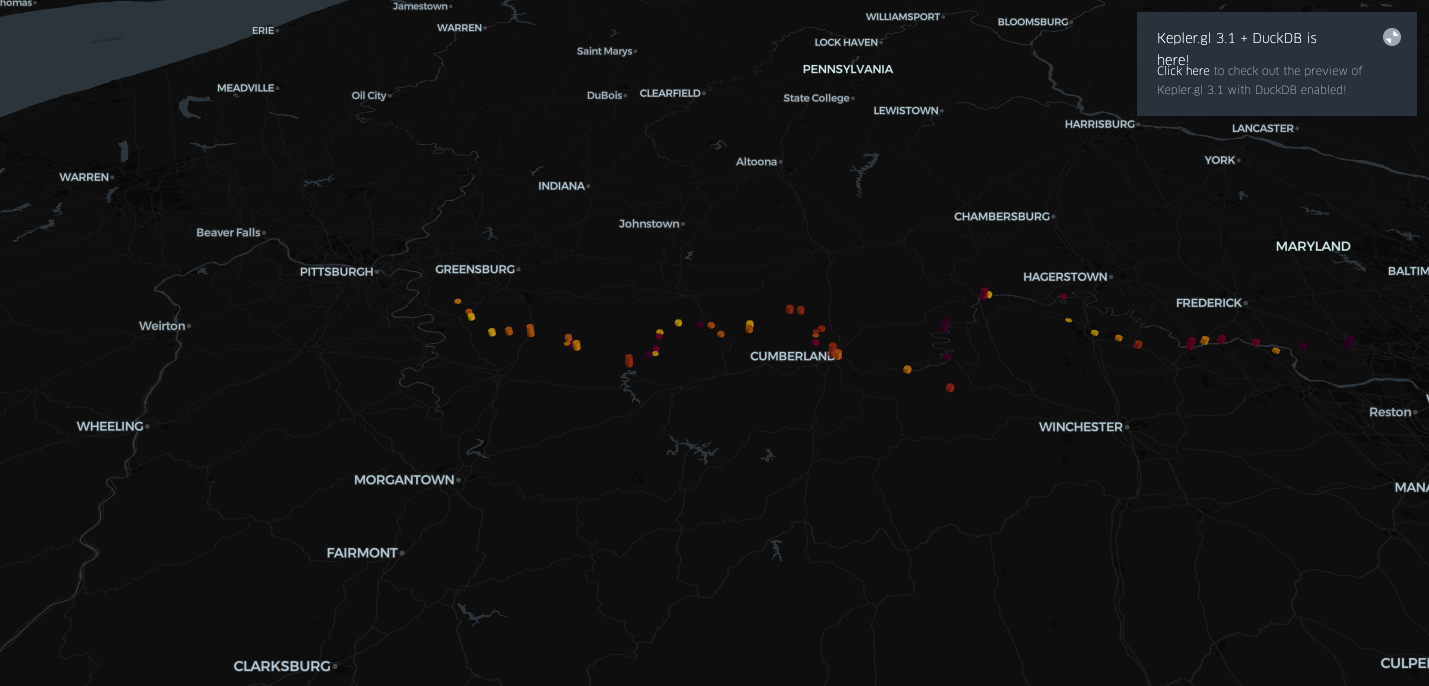
I’m playing with kepler.gl to visualize the data. This has exposted a few issues:
- I need minute-by-minute geolocation data for more accurate mapping of the pings. I’m testing GPSLogger for Android for this purpose. It writes GPX files, which are easier to work with. I’ve had good results with the gpxpy library.
- With ping, lower numbers are better, but I probably want the opposite for visualization, with total absence of data meaning there was no cell signal whatsoever.

I have a few trips coming up where I can play around with this.
As of November 7, 2025, you need to use the patch on Add support for encrypted location history from devices. ↩︎